
Database performance tuning: 800 stored procedures, 10 levels deep, no application changes
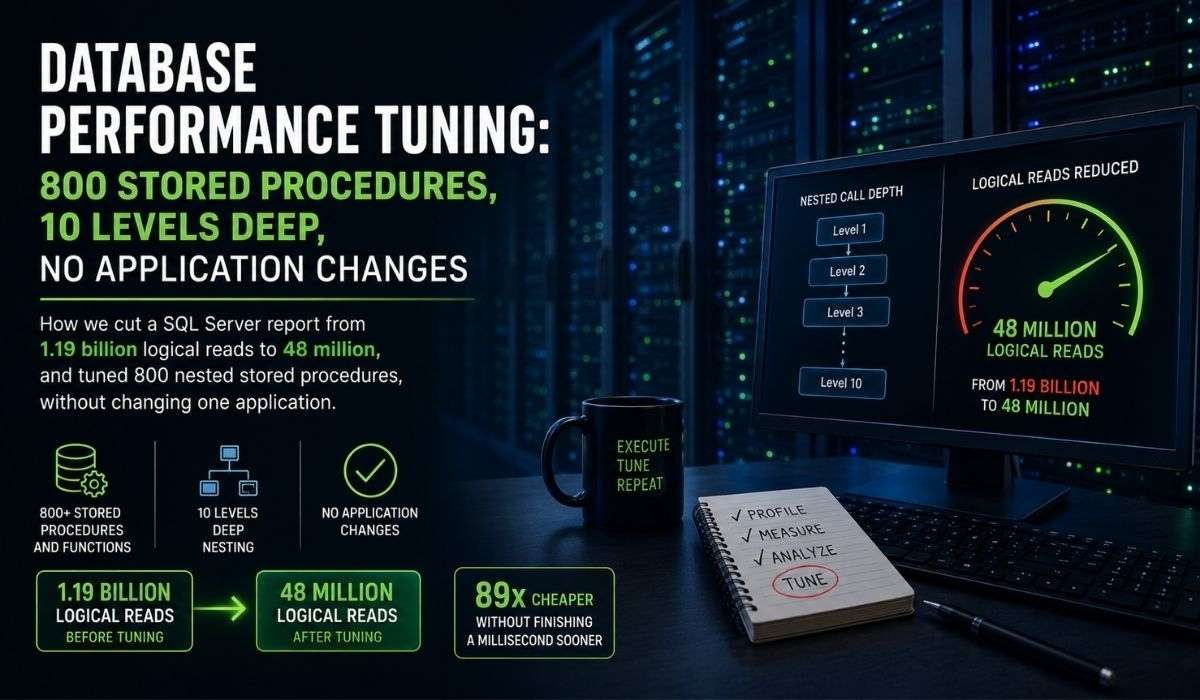
A multi-Billion dollar companyran more than 800 stored procedures and functions in one SQL Server database, with some functions nested up to 10 levels deep. Live applications called those functions directly, so the functions could not be replaced. One report procedure was doing 1.19 billion logical reads per run. After four months of database performance tuning, it was doing 48 million.
That constraint shaped the whole project. When an application depends on a function's signature, you can't rewrite it into a stored procedure and hand the client a list of code changes. You have to make the function fast while leaving its shape alone. Most SQL performance tuning advice skips that, because rewriting the caller is the easy answer on a whiteboard.
Below is what our team of three DBAs did over four months. Across the nested functions the gain came in at 45% to 80%. The two worst offenders did far better, and one got 89 times cheaper without finishing a millisecond sooner. That one is worth the read on its own.
The problem: 800 stored procedures and functions nested 10 levels deep
The database is the operational core of a warranty business. Vehicle service contracts, GAP products, claims, dealer setup, commissions, cessions, reinsurance accounting.
It ran that business for about 15 years, then outgrew the design it started with. That's a different problem, and a far more common one.
By the time we were brought in, one report took 6 minutes and 6 seconds. Batch close, the routine that posts a day's transactions, had grown into a cluster of a dozen objects calling each other, one of them 2,000 lines.
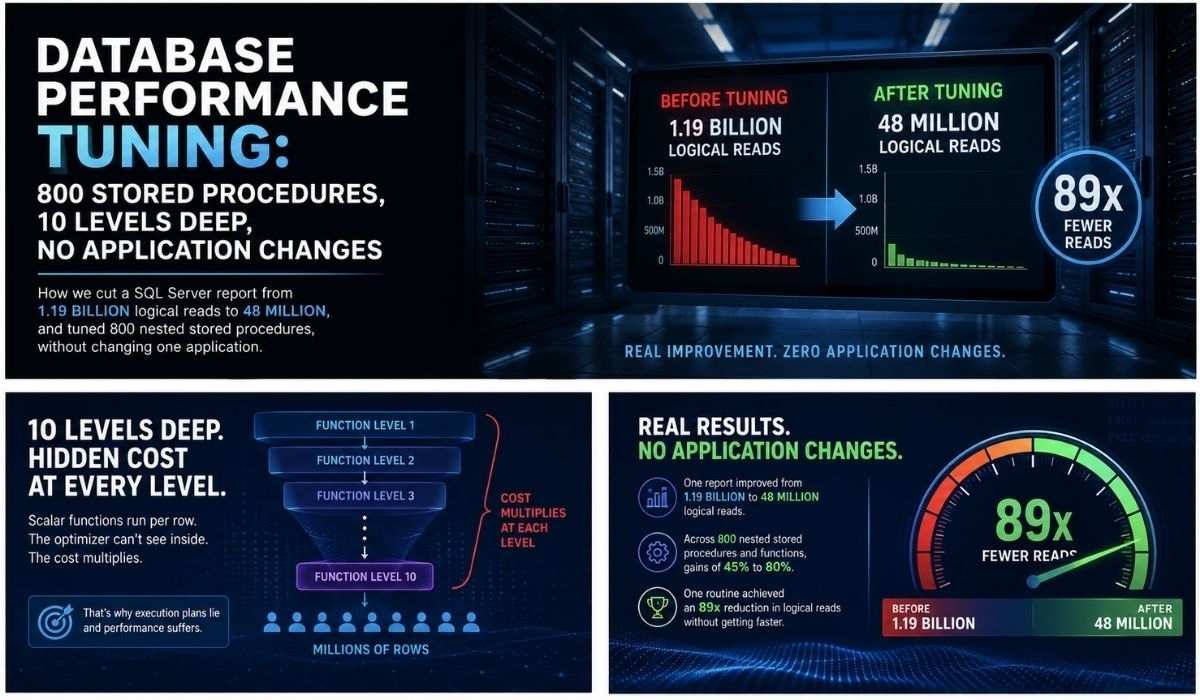
Ten levels of nesting means a function calls a function calls a function, eight more times. Every level hides cost from the one above it. Whoever wrote level 3 couldn't see what level 7 was doing to the read count. Neither could the optimizer.
Why nested SQL Server functions destroy query performance
A scalar function in SQL Server runs once per row, in its own execution context, and the query optimizer can't see inside it. The estimated plan shows a cost close to zero. The real work is row-by-row and invisible. Nest those functions several levels deep and the hidden cost multiplies at every level.
That's why the plan lies to you on code like this. You open the execution plan on a slow procedure expecting a fat scan somewhere, and you get a tidy-looking tree where nothing accounts for the 6 minutes you just waited.
The expensive part isn't in the plan at all, because SQL Server treats each scalar function call as a black box with a fixed guess attached. Multiply a wrong guess by 10 million rows and the estimate is off by orders of magnitude, which then poisons every join order and memory grant decision downstream.
That is why SQL performance tuning on legacy T-SQL feels like guesswork: the first tool people reach for is showing them a picture that leaves out the actual work.
What a scalar function costs per row
Say a function does one lookup against a 40,000-row table. Harmless on its own. Called per row against a 10-million-row result set, it's 10 million lookups. Put that inside another per-row function and you're multiplying, not adding.
That's how a procedure reaches 1.19 billion logical reads while every piece of it looks reasonable in isolation.
Why we did not just replace the functions with stored procedures
Because the applications called them. Converting a table-valued function into a stored procedure changes how a caller consumes it, so every application touching it would have needed rewriting, retesting and redeploying. The client wasn't in a position to take that on. Most companies aren't.
Say it plainly: replacing the functions outright would have produced better numbers. We hit the ceiling the constraint allowed, because the alternative was a project three times the size touching every application in the business.
Every database performance tuning engagement has a version of this. SQL Server consulting work lives in the gap between the ideal fix and the fix that ships.
How we found what was actually slow
Every SQL Server consulting engagement starts in the plan cache. We ranked the worst offenders by CPU and duration, using sp_BlitzCacheto pull and prioritize, then read the actual execution plans instead of the estimated ones. If you've never done that comparison on nested code, reading execution plans properly is the skill that makes everything else possible.
Query Store gave us the real production workload: plan changes and regressions over time instead of a snapshot. Extended Events gave us the parameter values users were actually passing. Several procedures behaved fine on our test parameters and fell apart on real ones, so tuning against invented inputs fixes the wrong things.
We also worked out what was clearing execution statistics on that server. Database performance tuning without trustworthy measurement is opinion.
Before touching code, we checked the free wins. Server settings, isolation levels, statistics, index maintenance. Codeless fixes cost nothing to test and sometimes remove the problem outright. Skip that step and a tuning project becomes a rewrite nobody needed.
One report procedure: 1.19 billion reads down to 48 million
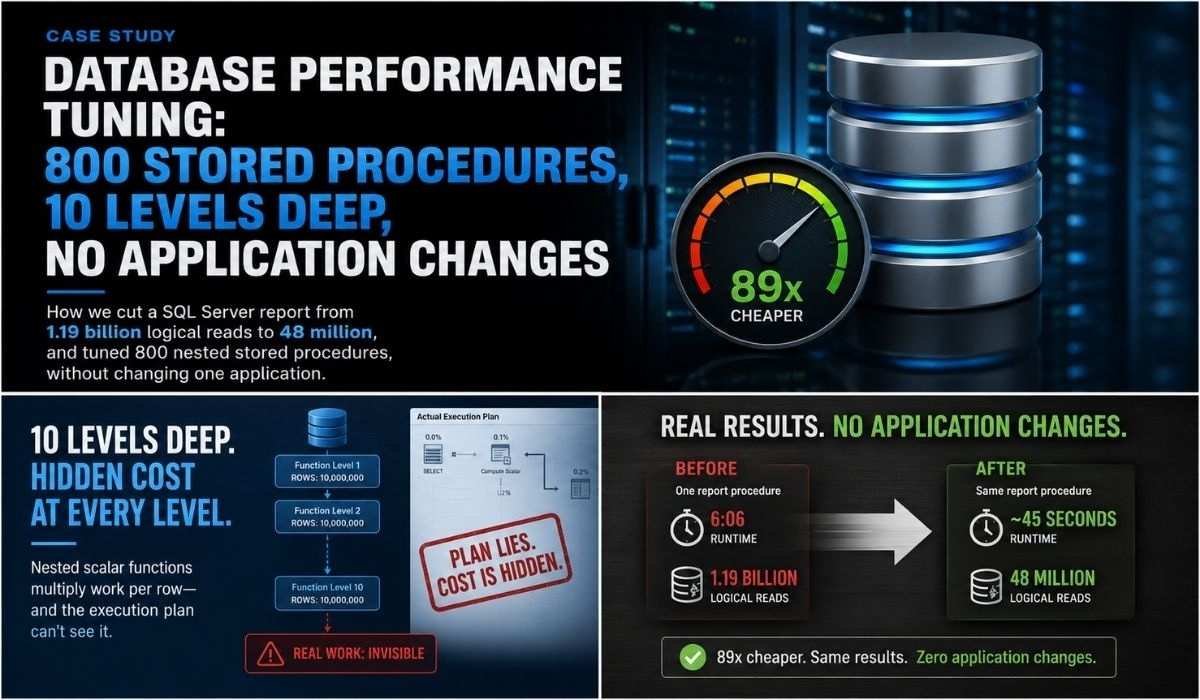
The cession report is a 5,000-line SSRS procedure. Before and after, measured with SQL Server execution statistics on 2023-03-01.
| Before | After | Change | |
|---|---|---|---|
| Runtime | 6 min 6 sec | 2 min 17 sec | 62.7% faster |
| CPU | 3,602,329 | 377,805 | 89.5% less |
| Logical reads | 1,186,630,733 | 47,999,588 | 96.0% fewer |
| Rows returned | 10,395,846 | 10,708,753 | comparable |
Four changes produced that. CTEs materialized into temp tables, an index added to one of them so it held up as volume grew, cursors removed, and the join order reworked so the INNER JOIN filters before the OUTER JOIN widens.
The join reorder is the one people underestimate. Filter first and fewer rows travel through every operator after it.
Converting scalar functions to inline TVFs, and when a CTE is slower than a temp table
Converting scalar and multi-statement functions into inline table-valued functions paid off more than anything else in the codebase. An inline TVF gets folded into the outer query, so the optimizer can finally see it, cost it, and reorder around it. Row-by-row execution disappears, and so does the fake estimate.
Multi-statement TVFs are the trap. They look like inline TVFs and behave like scalar functions, carrying a fixed row estimate whatever they return. Same fix applies.
The CTE finding surprised the client's developers. Most people write one expecting a temp table: a result set computed once and reused. The optimizer treats it as a definition it can expand inline on every reference, so code that hits one four times re-evaluates it four times. Writing it into an indexed temp table and joining to that is often far faster. Our general stored procedure tuning method covers the mechanics; this is that method under a constraint.
Smaller wins from the same pass: cursors replaced with set-based operations, GROUP BY moved from subqueries into CTEs, ORDER BY removed from temp table inserts nobody sorted on, query hints stripped from SELECTs forcing bad plans.
The legacy optimizer hints that were quietly costing years of performance
Several procedures carried this:
```sql
OPTION (USE HINT ('QUERY_OPTIMIZER_COMPATIBILITY_LEVEL_100'))
```
That pins the query to the SQL Server 2008 cardinality estimator. Someone added it years earlier to work around a regression. The regression was long gone. The hint stayed, and those queries ran on a 15-year-old estimator ever since, on a server upgraded twice.
Go grep your own codebase for `USE HINT` and `QUERY_OPTIMIZER_COMPATIBILITY_LEVEL` tonight. It takes 30 seconds and it's the highest payoff-to-effort ratio in SQL performance tuning. Confirm the hint still solves a live problem before removing it, then test.
Why one batch-close routine took six weeks
One DBA spent most of December and January inside that one batch-close cluster: a dozen procedures and functions, several calling each other, one of them 2,000 lines on its own.
Six weeks for one routine sounds bad until you look at the shape of it. You can't fix one object in isolation: six others call it, and each has its own callers. Every change gets traced up and down the tree and volume-tested before release.
Six weeks on a single routine is what SQL performance tuning looks like once the call tree gets this deep. Worth
knowing before you scope one.
Why 89x fewer reads with no speed gain is still a win
See the class chart procedure and its nested function, measured in the below:
| Before | After | Change | |
|---|---|---|---|
| Logical reads | 27,935,563 | 312,473 | 98.9% fewer |
| CPU | 36,000 | 13,725 | 61.9% less |
| Inner SELECT duration | 3,742 ms | 2,674 ms | 28.5% faster |
| Outer procedure duration | 3,804 ms | 3,804 ms | unchanged |
The outer procedure finished in exactly the same wall-clock time.
It's still one of the better results on the project. Logical reads are contention. Every page that procedure pulled competed with every other query on the server for memory, buffer pool space and I/O.
Cutting 27.9 million reads to 312,473 doesn't speed up that procedure, because its duration was bounded elsewhere. It gives capacity back to everything running alongside it, and the procedure keeps behaving as volume grows instead of falling off a cliff.
The cause: a second-level nested function reading far more rows than the result needed. Moving that logic up into its caller collapsed the read volume. Same answer, 89 times less data touched. Same principle behind processing hundreds of millions of records without the server falling over.
What changed: 45-80% faster, no application changes
Across the deeply nested functions, 45% to 80% faster. Lower CPU, lower memory pressure, a more stable server, and not one application change. The two procedures above are the worst offenders, shown as worked examples. The 45% to 80% is the project-wide number.
Every change went through Git with pull requests, tracked as user stories in an Azure DevOps backlog, volume-tested, then handed to the client's team who ran QA and controlled the release. We never deployed to production. Handover included a written performance report and a prioritized backlog.
This was iterative. The plan after deployment was another analysis cycle against the new baseline, then repeat. Nobody who has run one of these expects one pass.
Getting a second opinion on your own database
If reports on your SQL Server keep getting slower and nobody can say why, that's where outside database experts pay for themselves. Two weeks of someone else's attention tells you whether you have a tuning problem or a design problem. Those cost very different amounts to fix.
You don't have to put database experts on payroll to get that read. Our SQL Server database administrator team works with companies that have no full-time DBA, and with in-house teams that need capacity they can't justify hiring for. Remote DBA support means paying for the hours the database needs instead of a salary.
For a database shaped like this one, remote DBA coverage plus a scoped database performance tuning engagement is usually the whole answer, and that combination is most of our SQL Server consulting work.
For a database shaped like this one, remote DBA coverage plus a scoped database performance tuning engagement is usually the whole answer, and that combination is most of our SQL Server consulting work.
Call 732-536-4765 or book a free consultation and we'll tell you what we'd look at first.

I started to develop custom software since 1985 while using dBase III from Aston Tate. From there I moved to FoxBase and to FoxPro and ended up working with Visual FoxPro until Microsoft stopped supporting that great engine. With the Visual FoxPro, I developed the VisualRep which is Report and Query Engine. We are also a dot net development company, and one of our projects is a web scrapping from different web sites. We are Alpha AnyWhere developers, and the Avis Car Rental company trusted us with their contract management software that we developed with the Alpha Five software Engine.
Comments